Admitted Students: Class of 2029
Emory University has many ways to understand the academic strength and diversity of its applicants. Here is a snapshot of the middle 50% of the admitted Class of 2029, students who enrolled in fall 2025.
Data as of June 2025.
*Test Optional: Emory University was test optional for the 2025 admission cycle. Not all applicants choose to submit test scores when applying. Testing statistics are taken from applicants who submitted test scores with their application.
Emory College
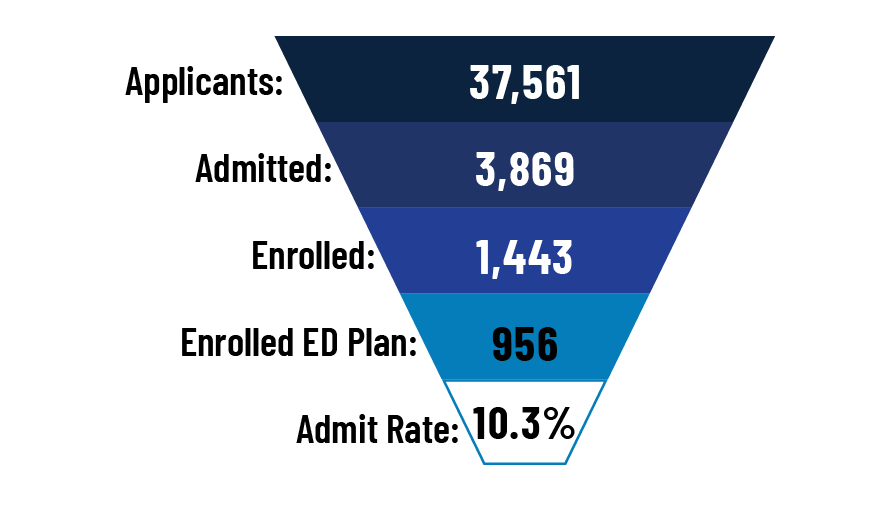
Academics
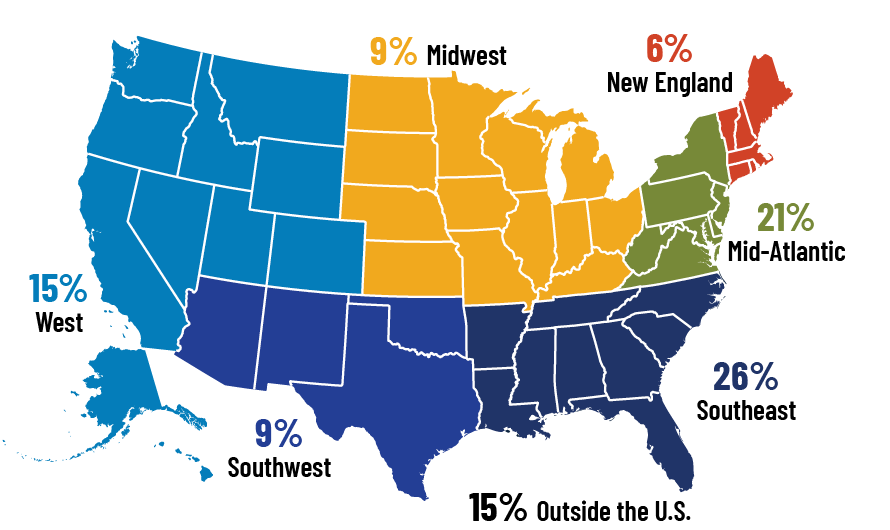
Region of Origin

Geographic Distribution
Emory College admitted Class of 2029

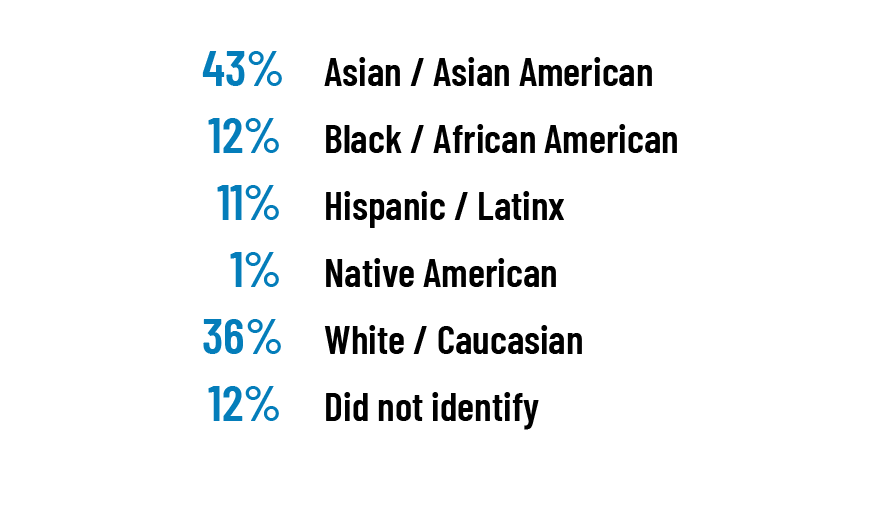
Self-Identified Domestic Race/Ethnicity
Emory College admitted Class of 2029. Because some students identify as more than one race, the self-identified race/ethnicity numbers may exceed 100 percent.
Oxford College
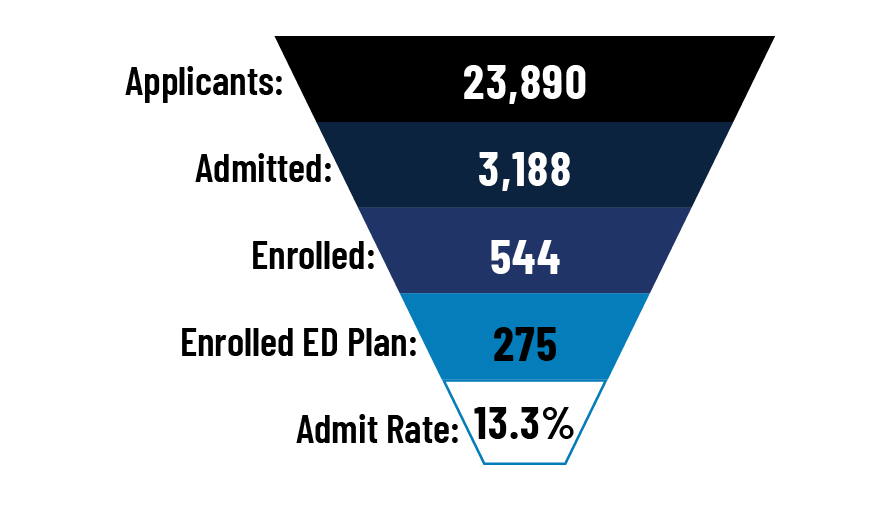
Academics
Region of Origin
GEOGRAPHIC DISTRIBUTION
Oxford College admitted Class of 2029
Self-Identified Domestic Race/Ethnicity
Oxford College admitted Class of 2029. Because some students identify as more than one race, the self-identified race/ethnicity numbers may exceed 100 percent.